
This report allows you to analyze the profit margins of your sales, providing a clear view of the financial performance of your products and services. With it, you can identify which items generate the highest profitability and make strategic decisions with greater confidence. Below, you will see how to generate this report simply and efficiently. To generate the report, click on Sales > Reports > Margins.
On the next page, enter the following information:
- Start date
- End date
- Type
Check or uncheck the option "Show graph." Then click on Send.
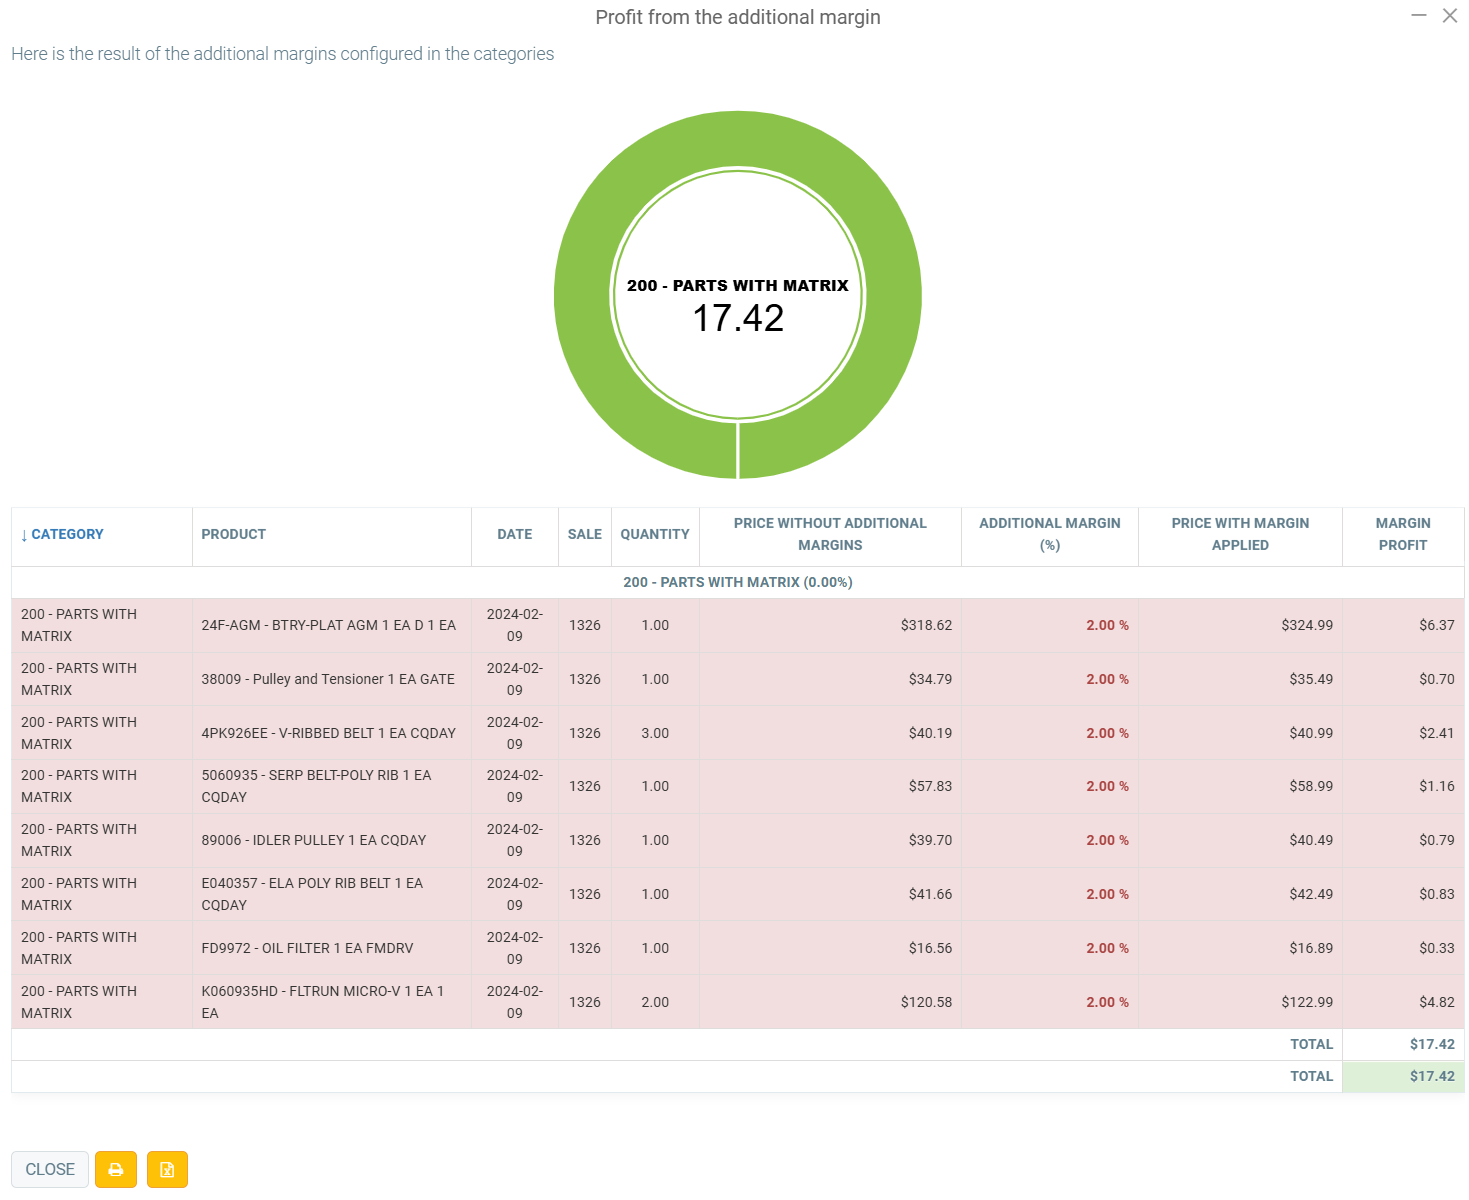
In our example, we have chosen to display the graph. Below it is the data relating to margins based on the previously selected date:
- Category
- Product
- Date
- Sale
- Quantity
- Price without additional margin
- Additional margin (%)
- Price with margin applied
- Margin profit
Next to the Close button, you can print by clicking on the Printer icon or you can Export to Excel.
Comments
Please sign in to leave a comment.