
This feature allows you to view your sales chronologically, adapting the analysis to the period you prefer. You can view weekly, monthly, annual, daily, fiscal year, or accounting period results. This makes it easier to identify trends and track performance over time.
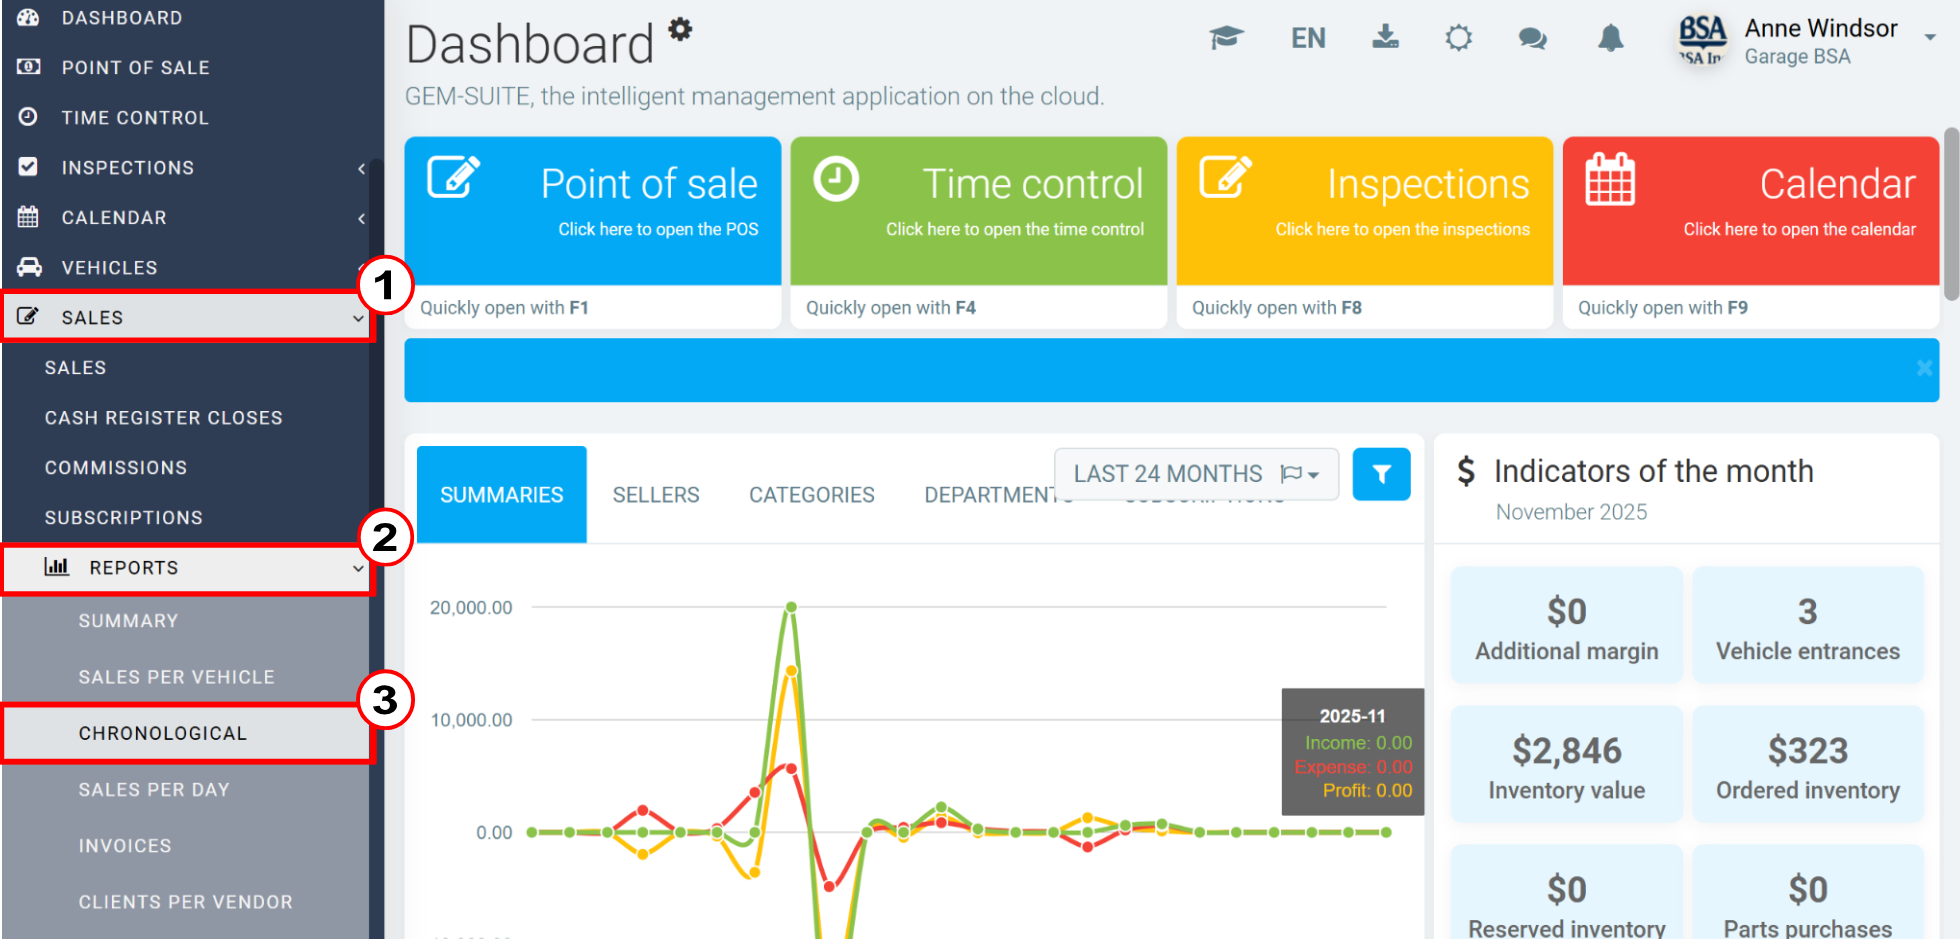
To generate a chronological sales report, click on Sales > Reports > Chronological.
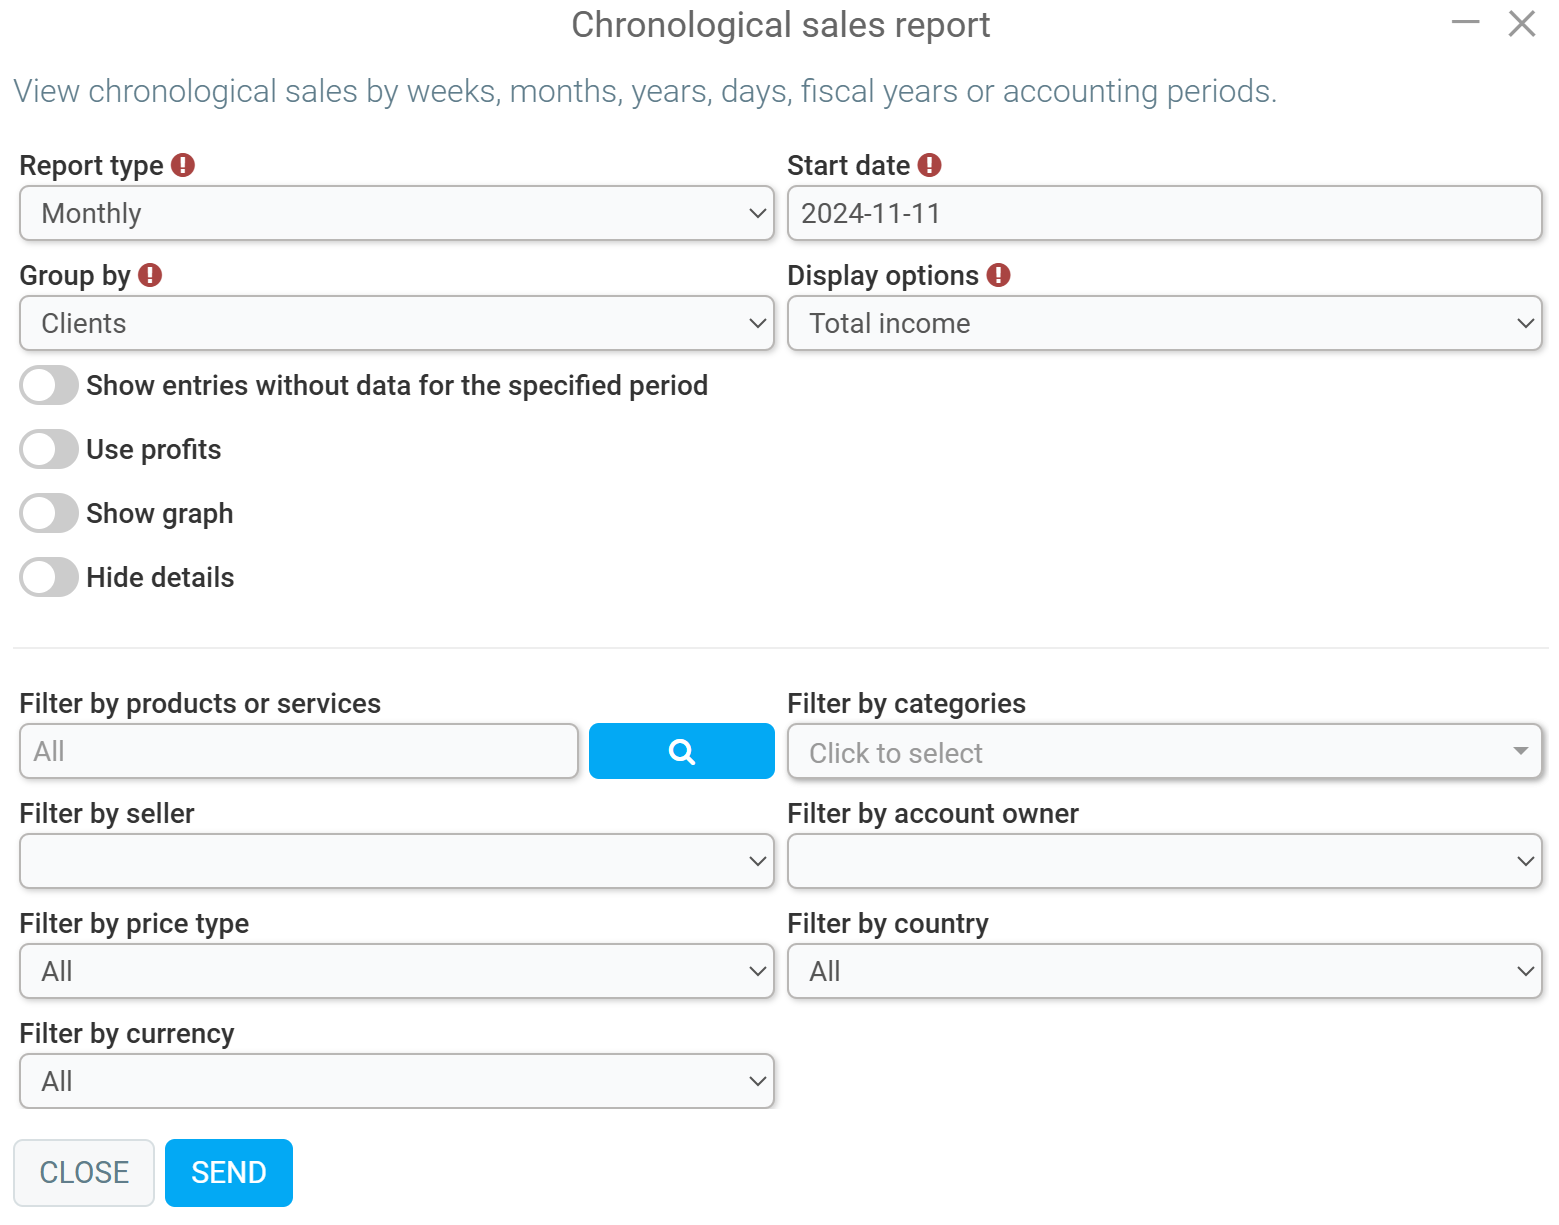
On the page titled Chronological sales report, enter the following required information:
- Report type
- Start date
- Group by
- Display options
Among the options, you can select or deselect the following:
- Show entries without data for the specified period
- Use profits
- Show graph
- Hide details
Among the filters, you will have the following options:
- Filter by products or services
- Filter by categories
- Filter by seller
- Filter by account owner
- Filter by price type
- Filter by country
- Filter by currency
After selecting the options that best suit your needs, click on Send.
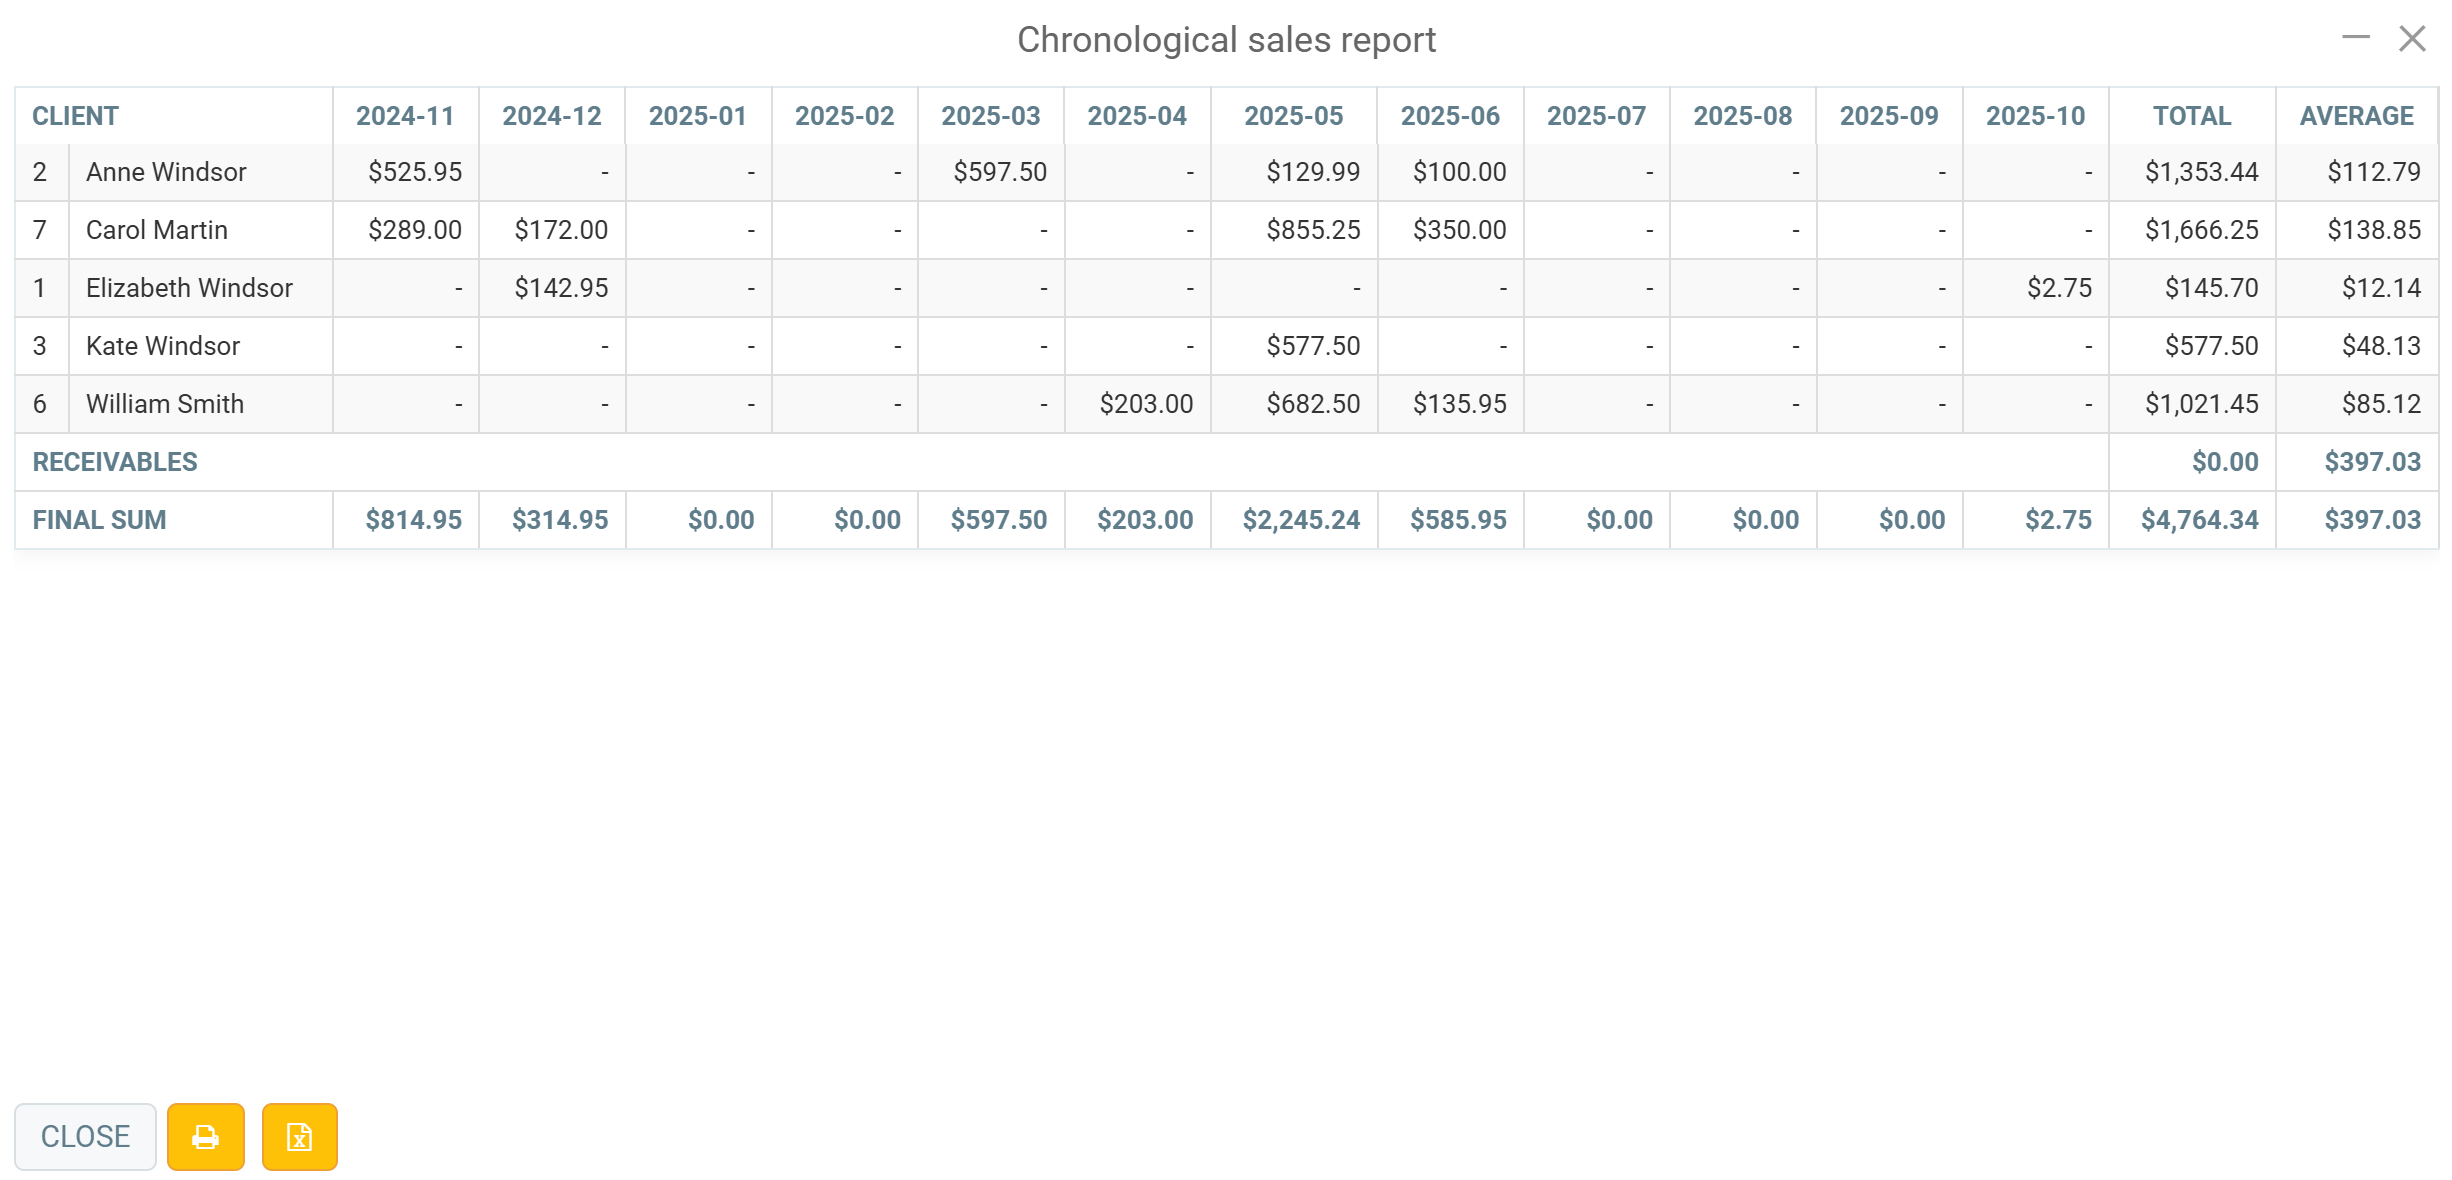
The next page will display the report based on the options and filters selected previously.
In our case, the report shows the client's name and the amounts spent each month, the total, and the average.
Next to the Close button, you can print by clicking on the Printer icon or you can Export to Excel.
Comments
Please sign in to leave a comment.